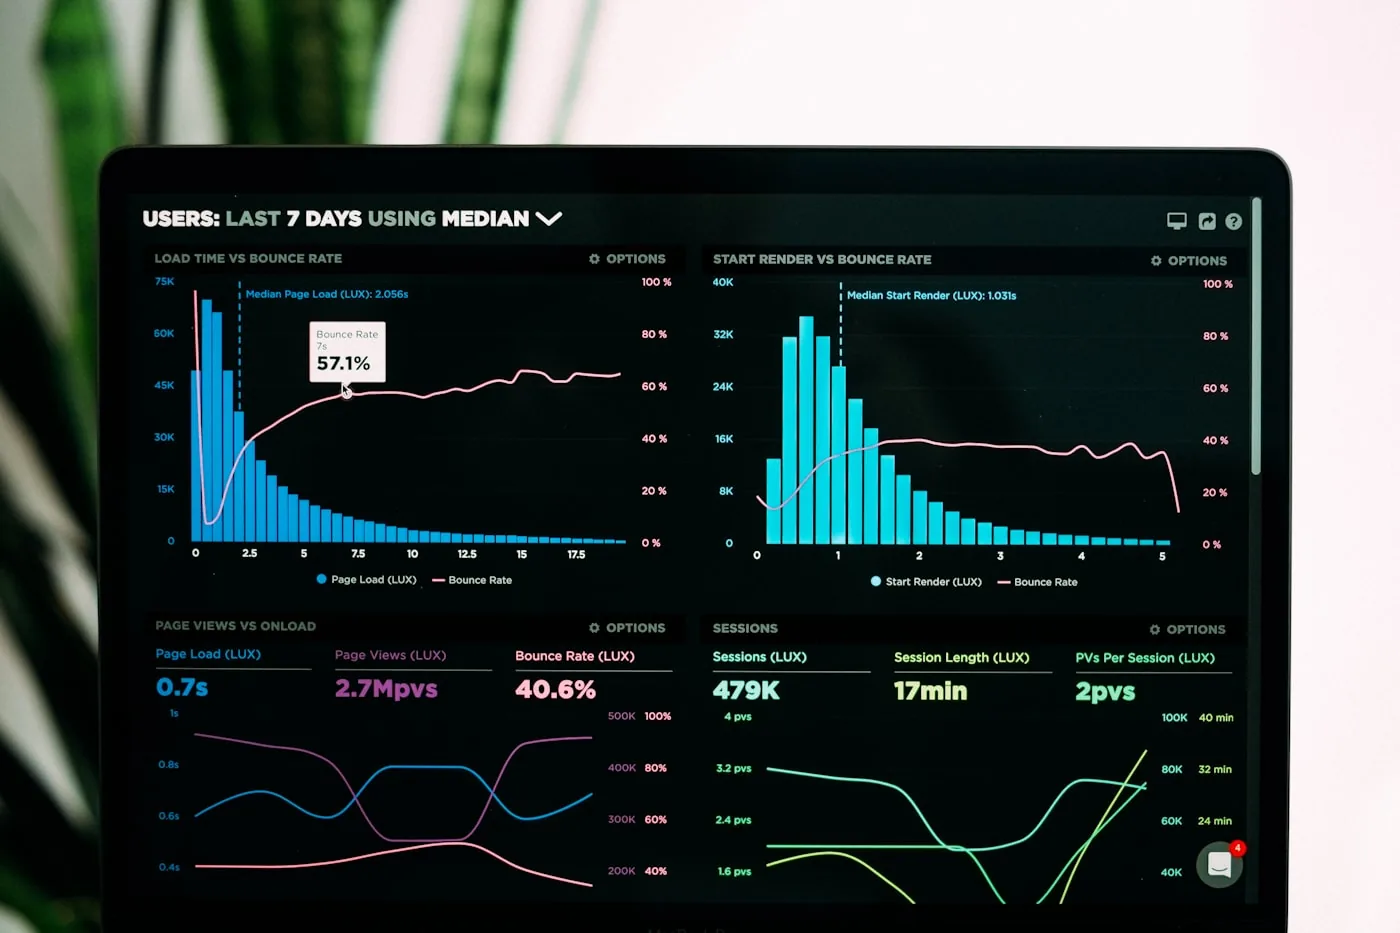

The PageSpeed report shows an LCP of over six seconds. The filmstrip in the same report shows a fully painted page after roughly one second. Both are correct, and that contradiction is exactly why decorative layers, frame sequences and background videos so often ruin the measurement even though they play no visual role whatsoever.
During the V3 optimisation of emit-solution.com on 9 July 2026 this was the core of the problem. The PageSpeed score rose from 70 to somewhere between 92 and 96, and the LCP fell from 6.7 to 2.4 seconds. Those are lab values from the simulation, not field data. One central building block was a gate that starts deferred work only after the last LCP candidate.
Why deferred work ends up in the LCP at all
Lighthouse uses simulated throttling by default, and so does PageSpeed Insights. The page is loaded unthrottled on the test runner, after which the Lantern model extrapolates the metrics to a mobile profile. The preset works with 1638 Kbps download, 750 Kbps upload, 150 ms RTT and a fourfold CPU slowdown. The Lighthouse documentation itself admits an “inherent inaccuracy”, because alternative execution paths have to be predicted.
The decisive trap sits in how the chain is built. Lantern counts every request that starts before the observed LCP as an LCP dependency, regardless of whether the paint needs it. A page that actually paints in 1.5 seconds but kicks off 300 images and frames in parallel ends up with a simulated LCP of over six seconds. CPU tasks before the paint enter the chain with a factor of four in exactly the same way, which means synchronous inline scripts and hydration, and they show up in the LCP breakdown as render delay.
That defines the actual task. It is not about loading less. It is about starting later, and demonstrably later than the last LCP candidate.
 Photo: kommumikation / Unsplash
loading=“lazy” is a distance gate
The first remedy most people reach for does not measure time at all. Chromium loads lazily marked images from 1250 px away from the viewport on 4G and from 2500 px on 3G or slower. Images that would be visible without scrolling load normally, regardless of the loading attribute.
For decorative full-screen layers that is precisely the wrong case. They sit inside the viewport. And the obvious trick does not help either. opacity: 0 does not prevent the load in Chrome, Safari or Firefox, the image is fetched anyway. Only display: none suppresses the request. The Chrome guidance is worded accordingly clearly, namely not to lazy load images that are likely to sit inside the viewport during page load, and LCP images least of all.
The mistake is common enough that Lighthouse has a dedicated audit for it, lcp-lazy-loaded. The Web Almanac 2025 puts the share of pages that lazy load their LCP image at around 16 to 17 per cent, unchanged from 2024. Broken down, that is 10.4 per cent on mobile and 11.5 per cent on desktop through native loading=“lazy”, plus 5.9 per cent on mobile through custom data-src solutions. For comparison, fetchpriority=“high” sits at 16.3 per cent on desktop and 17.3 per cent on mobile, while preload only reaches 2.1 to 2.2 per cent.
requestIdleCallback and window.load are coin flips
requestIdleCallback sounds like the right semantics and is still not a dependable brake. MDN lists the API as “Limited availability”, and caniuse reports around 80.95 per cent global support. For Safari the reporting is inconsistent. caniuse lists desktop and iOS Safari as unsupported up to and including 26.3, while at the same time marking versions 13.1 to 26.5 as disabled by default and only active in the Technology Preview. No dependable shipping date can be derived from that, and the tracking issue at WebKit is bug 164193. On top of that come the semantics themselves. Callbacks run in idle phases at the end of a frame or during user inactivity, and MDN explicitly warns that without a timeout they may not fire for several seconds. During my own V3 optimisation I additionally noticed the callback running almost immediately on a fast machine. That is a single observation and not a rule, but combined with the documented delay in the other direction, nothing remains that you could build a gate on.
With window.load the situation is different from what you commonly read. The claim that load generally fires before the LCP is not a general rule and cannot be supported that way. What can be supported is the mechanism behind it. Lighthouse and PSI measure on an unthrottled runner, and load sits close enough to the observed paint there that the work started afterwards still falls into the simulated chain. From my own V3 optimisation there is a documented number for this. Identical code produced 2.1 seconds of simulated LCP once and 6.2 seconds another time. That demonstrates the instability, nothing more, but it is enough of a verdict. You do not build a deployment on that.
 Photo: redaquamedia / Unsplash
How the LCP entry actually works
The entry type is called exactly largest-contentful-paint, as defined by the W3C specification in section 3.1. Three properties determine what a gate has to look like.
First, the browser fires several entries per page view. One as soon as the first frame is painted, and after that a new one every time the largest contentful element changes. The spec words this in section 1.1 as a new entry being created for each newly found largest content.
Second, there is no signal for which entry is the final one. Google therefore explicitly recommends reporting only the most recently fired entry. The official web-vitals library works exactly that way, with the buffered flag set, and whether reportAllChanges is set does not change the finally reported value.
Third, the search ends on user interaction. Section 4.2 of the spec stops reporting once the window has dispatched a scroll or input event. That can be used as a shortcut, because when the user scrolls, they need the content immediately anyway.
The canonical evaluation pattern looks like this, with type instead of entryTypes, because buffered is only permitted in that combination:
const observer = new PerformanceObserver((list) => {
  const entries = list.getEntries();
  const lastEntry = entries[entries.length - 1];
  console.log('LCP:', lastEntry.startTime, lastEntry.element);
});
observer.observe({ type: 'largest-contentful-paint', buffered: true });
The gate
The version this leads to combines four building blocks. A settle timer restarts after every LCP entry, a hard fallback timer takes over if no entry arrives at all, an interaction shortcut fires immediately, and a feature detection decides up front whether waiting for entries is possible in the first place.
That last point matters and was solved incorrectly in my original version. A try/catch around observe() does not help, because observe() aborts silently for an unsupported type and throws no exception. The Performance Timeline spec says in step 7.2 of the algorithm that the steps are aborted if the type is not contained in the frozen array of supported entry types. On a Safari older than 26.2 the code therefore never reaches the arm() branch, it sits in the fallback timer for a full five seconds. The correct check goes through PerformanceObserver.supportedEntryTypes:
function afterLcp(fn, settleMs) {
  var done = false, po = null;
  var settle = Math.max(settleMs || 0, 1600);
  var supported = typeof PerformanceObserver !== 'undefined' &&
    PerformanceObserver.supportedEntryTypes &&
    PerformanceObserver.supportedEntryTypes.indexOf('largest-contentful-paint') !== -1;

  // without LCP support go straight to the short timer, not the 5s fallback
  var timer = setTimeout(fire, supported ? 5000 : settle);

  function fire() {
    if (done) return;
    done = true;
    clearTimeout(timer);
    try { po && po.disconnect(); } catch (e) {}
    fn();
  }
  function arm() {                       // rewind after every LCP entry
    clearTimeout(timer);
    timer = setTimeout(fire, settle);
  }
  if (supported) {
    po = new PerformanceObserver(arm);
    po.observe({ type: 'largest-contentful-paint', buffered: true });
  }
  ['pointerdown', 'wheel', 'touchstart', 'keydown'].forEach(function (ev) {
    window.addEventListener(ev, fire, { once: true, passive: true });
  });
}
The 1600 ms settle time is an empirical value from my own optimisation and cannot be derived from the spec. Going shorter risks a late font swap or a hero element sliding into place producing another entry after the gate has already fired.
In my own implementation the gate carries frame sequences, videos, decorative full-screen layers and speculative font loads. The markup side looks like this, with data-src instead of src and a video that does not preload:
<img class="decor" data-src="/layer.webp" alt="" decoding="async">
<video id="bg" preload="none" muted playsinline></video>
And the application inside the gate:
afterLcp(function () {
  document.querySelectorAll('img[data-src]').forEach(function (el) { el.src = el.dataset.src; });
  document.querySelectorAll('[data-bg]').forEach(function (el) { el.style.backgroundImage = 'url(' + el.dataset.bg + ')'; });
  var v = document.getElementById('bg'); if (v) { v.src = '/bg.mp4'; v.load(); }
}, 1600);
What can break the gate
Four points belong on the checklist before you rely on this pattern.
Elements with opacity: 0 are excluded as LCP candidates by the Chromium heuristics, because they are invisible to the user. A layer held transparent therefore does not shift the LCP, but it still loads, see above.
Since Chrome 112, LCP also ignores images with less than 0.05 bits of image data per rendered pixel. The rollout began around 6 April 2023 and applies retroactively from Chrome 109. That mainly affects large plain background images, viewport overlays and placeholders. Both of these are Chromium heuristics, not spec requirements, and other engines may behave differently.
 Photo: thilak_cm212 / Unsplash
After a restore from the back/forward cache, the API reports no largest-contentful-paint entries at all. In that case only the fallback timer carries the load, which is another argument for not setting it too generously.
What I have not tested is the behaviour during client-side navigation via the View Transitions API. Because LCP entries are created per document, a second navigation within the same document can be expected to produce no further entries, which would mean wiring the gate up differently there. I have not measured that. Equally open is whether programmatic scrolling ends the LCP search in the same way that real user input does.
Verify the result instead of believing it
The first diagnostic step is always the comparison between observed and simulated LCP:
npx lighthouse <url> --form-factor=mobile --screenEmulation.mobile --throttling-method=simulate \
  --only-categories=performance --output=json --output-path=audit.json --chrome-flags="--headless=new"
In the JSON, audits.metrics holds the value observedLargestContentfulPaint, which is the real paint time. If the observed FCP equals the observed LCP and both are fast while the simulation is slow, you have a chain problem and not a rendering problem. It is also worth looking at audits['largest-contentful-paint-element'] and audits['network-requests'], filtered on networkRequestTime smaller than the observed LCP. That is the actual chain.
Single runs are worthless. In my own optimisation, identical code was measured once at 52 and once at 95 points, because PSI runners scatter heavily. Three runs, median. A TBT above 0.5 seconds with otherwise identical values points to a slow runner, not to the page.
 Photo: justin_morgan / Unsplash
And the gate is rarely the only lever. Render-blocking CSS was the concealing factor in my case, where 42 KB of external CSS alone cost around 3.5 seconds of simulated LCP, solved through build: { inlineStylesheets: 'always' } in Astro. Moving synchronous inline scripts in the body into a defer queue brought the observed paint down from 1.34 to 1.07 seconds. And the eagerly loaded web fonts were reduced from 13 to 3. Anyone who wants to go deeper into how the metrics are weighted will find that in the Lighthouse scoring documentation.
Finally, the framing that is easy to forget. Google ranks on CrUX field data, not on the lab value. Whether an LCP gate improves the field values or mainly the simulation is not established. The lab value stays useful all the same, because it exposes the chain that hits real users on a poor connection just as hard.
If your PageSpeed report shows a slow LCP while the filmstrip shows a page that finished early, the problem is almost always in that chain and not in the rendering. Send me a short note with the value you are seeing and what the page loads on top, and I will look at the Lighthouse report and tell you whether a gate is the right lever.
FAQ
Why does an image with loading="lazy" still load immediately?+
Because loading="lazy" evaluates the distance to the viewport, not the point in time. Chromium loads lazily marked images from around 1250 px away from the viewport on 4G and from 2500 px on 3G or slower. Anything that would be visible without scrolling loads normally. An element with opacity: 0 also counts as visible for loading purposes, only display: none prevents the request in Chrome, Safari and Firefox.
How do I identify the final LCP entry?+
Not directly. The specification states that a new entry is created for every new largest content element, and there is no signal for the last one. Google therefore recommends always evaluating only the most recently fired entry. In practice you work with a settle timer that restarts after every new entry.
Does scrolling end the LCP measurement?+
Yes. The specification stops reporting as soon as the window has dispatched a scroll or input event. web.dev puts the same thing in practical terms: the browser stops creating new entries once the user interacts by tap, scroll or key press. After a restore from the back/forward cache, the API reports no largest-contentful-paint entries at all.
Which browsers support LargestContentfulPaint?+
Chrome from version 77, Edge from 79, Firefox from 122, and Safari and iOS Safari only from 26.2. caniuse reports around 89.19 per cent global support, and MDN has listed the API as Baseline since December 2025. For every other browser a gate needs its own time path, otherwise it waits far longer than necessary.
Want to know more?
In a free intro call we discuss how you can use these topics for your company. Not a sales pitch, but an honest assessment.
Book a free intro call