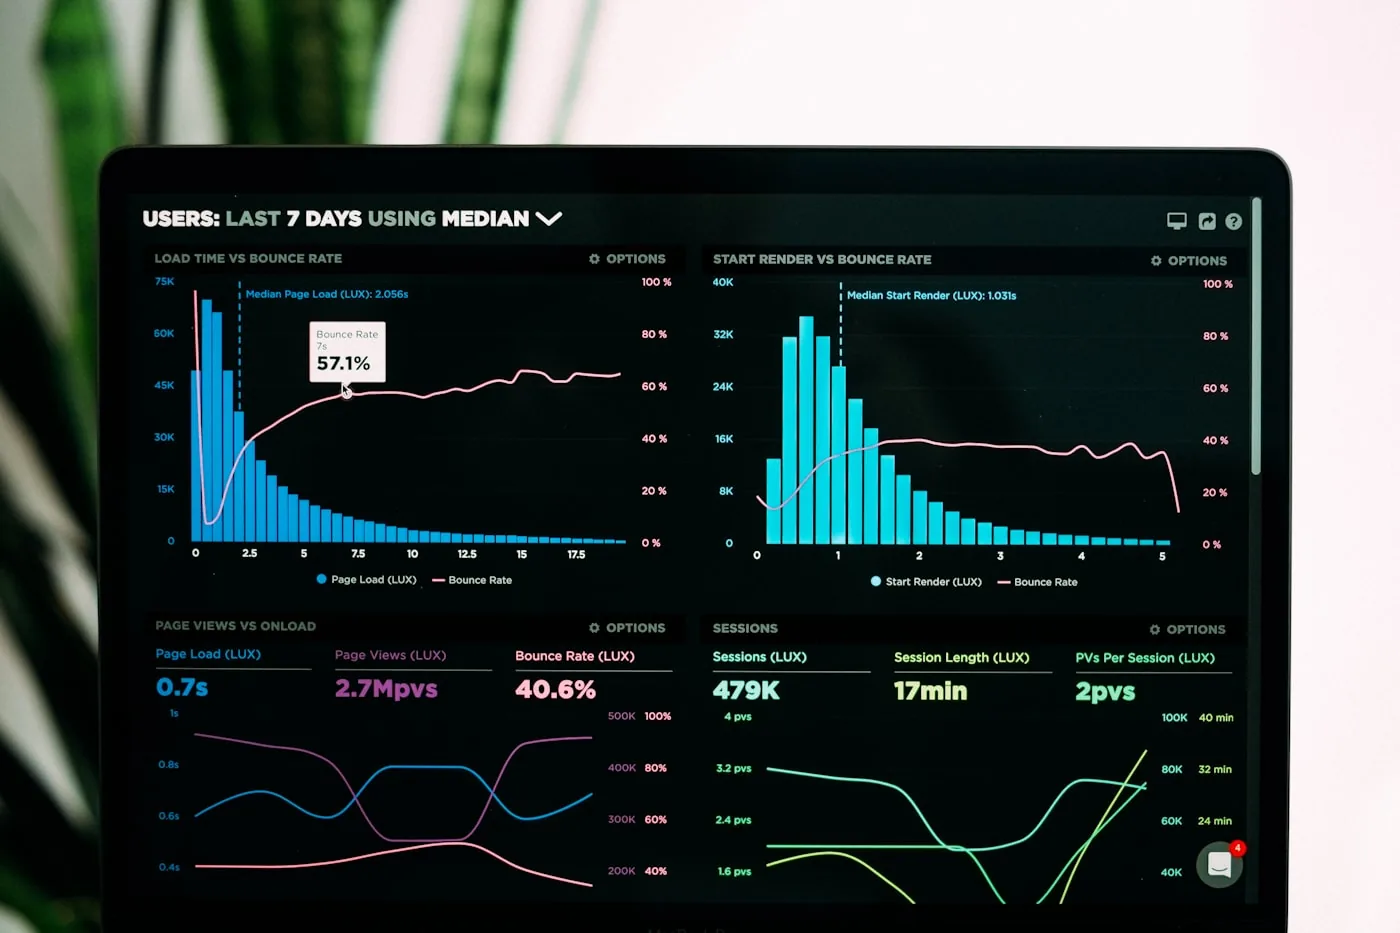

The filmstrip in the PageSpeed report shows a fully painted page after roughly one and a half seconds. The metric above it says 6.7 seconds LCP. Both sit in the same report, and both are correct. Anyone who starts compressing images or preloading the hero image at this point is optimising the wrong end. The value does not come from the image.
That exact case was the starting point of the V3 optimisation of emit-solution.com on 9 July 2026. The performance score went from 70 to somewhere between 92 and 96, and the simulated LCP from 6.7 to 2.4 seconds. The largest part of that improvement had nothing to do with the LCP element.
 Photo: lukechesser / Unsplash
The default mode does not measure, it simulates
Lighthouse loads the page unthrottled in its default mode. Only afterwards does a model extrapolate the metrics onto a slow mobile device. In core/config/constants.js the default is set as throttlingMethod: 'simulate'. The simulation engine is called Lantern, and since 2024 it no longer lives in the Lighthouse repository but in the trace engine part of Chrome DevTools. Lighthouse merely re-exports it.
The mobile profile mobileSlow4G is hard coded.
mobileSlow4G: {
  rttMs: 150,
  throughputKbps: 1.6 * 1024,
  requestLatencyMs: 150 * DEVTOOLS_RTT_ADJUSTMENT_FACTOR,
  downloadThroughputKbps: 1.6 * 1024 * DEVTOOLS_THROUGHPUT_ADJUSTMENT_FACTOR,
  uploadThroughputKbps: 750 * DEVTOOLS_THROUGHPUT_ADJUSTMENT_FACTOR,
  cpuSlowdownMultiplier: 4,
},
According to the comment in the code this corresponds to WebPageTest’s Fast 3G profile and roughly to the 75th percentile of 4G connections. Desktop runs on desktopDense4G, so 40 ms RTT, 10 Mbit/s and CPU factor 1. The Lighthouse documentation names the limits of this approach itself and speaks of an “inherent inaccuracy”, because alternative execution paths have to be predicted. For deep analysis it recommends packet level throttling.
How the LCP graph is built
Lantern builds two dependency graphs per metric, an optimistic and a pessimistic one, simulates both separately and averages the result. For LCP the coefficients are {intercept: 0, optimistic: 0.5, pessimistic: 0.5}, so the reported value is simply the mean of two model calculations.
The interesting part is how the graph gets trimmed. It ends at the observed LCP timestamp, and for network nodes the end time decides.
// Exclude all nodes that ended after cutoffTimestamp
// (except for the main document which we always consider necessary)
const endedAfterPaint = node.endTime > cutoffTimestamp || node.startTime > cutoffTimestamp;
if (endedAfterPaint && !node.isMainDocument()) {
  return false;
}
This is where the widespread short version becomes imprecise. It is not every request that starts before the LCP. It is every request that finished before the observed LCP. A request that starts early and only ends after the paint drops out of the graph. A small tracking pixel that completes 80 milliseconds before the paint stays in. For CPU nodes the start time applies instead, with a comment in the code noting that the paint event can sit inside the render blocking task.
The optimistic graph only filters out images with priority Low or VeryLow. The pessimistic one takes everything and additionally pulls in every CPU node that performed a layout. Lighthouse maintainer adamraine writes in the open issue 15737 that the optimistic graph is “extremely similar to the pessimistic graph”.
 Photo: alessiozaccaria / Unsplash
And then comes the step that explains everything.
static override getEstimateFromSimulation(simulationResult: Simulation.Result): Simulation.Result {
  const nodeTimesNotOffscreenImages = Array.from(simulationResult.nodeTimings.entries())
      .filter(entry => LargestContentfulPaint.isNotLowPriorityImageNode(entry[0]))
      .map(entry => entry[1].endTime);

  return {
    timeInMs: Math.max(...nodeTimesNotOffscreenImages),
    nodeTimings: simulationResult.nodeTimings,
  };
}
Math.max over the end times of all nodes. By definition the simulated LCP is the point at which the last node in the graph finishes, not the point of a paint. The same maintainer spells out the consequence in the issue, namely that shortening an unimportant request can improve the LCP purely because that request happened to be the last one in the graph.
On top of that, the simulator splits the available bandwidth evenly across all running requests, via connection.setThroughput(this.throughput / inFlight). Many parallel requests therefore slow each other down inside the model. With a maximum of ten concurrent requests and a start time penalty by priority, from 0 seconds at VeryHigh up to 2 seconds at VeryLow, that adds up quickly.
Step one of the diagnosis
First you need both numbers side by side. A local run in the same mode as PSI.
npx lighthouse https://example.com \
  --form-factor=mobile --screenEmulation.mobile \
  --throttling-method=simulate \
  --only-categories=performance \
  --output=json --output-path=audit.json \
  --chrome-flags="--headless=new"
Then the decisive line.
jq '.audits.metrics.details.items[0] | {simulated: .largestContentfulPaint, observed: .observedLargestContentfulPaint, fcp_observed: .observedFirstContentfulPaint, ttfb: .timeToFirstByte, lcpLoadDelay, lcpLoadDuration, lcpRenderDelay}' audit.jsonThe same artefact writes both values into the same object. The identical query works against the PageSpeed Insights API, where it sits below lighthouseResult.
curl -s "https://www.googleapis.com/pagespeedonline/v5/runPagespeed?url=https%3A%2F%2Fexample.com&strategy=mobile&category=performance&key=$PSI_KEY" \
 | jq '.lighthouseResult.audits.metrics.details.items[0] | {simulated: .largestContentfulPaint, observed: .observedLargestContentfulPaint}'
As a cross check, a run without simulation helps. With --throttling-method=provided Lighthouse returns the trace value directly and sets the CPU multiplier to 1. What comes out of that says nothing about slow networks, but it separates a rendering problem from a chain problem cleanly.
One note on expectations. A local run does not reproduce PSI one to one. Google adjusted the CPU throttling factor for PageSpeed Insights on 5 December 2024, according to the release note “to account for the low CPU performance benchmarks typical in PageSpeed Insights production environments”. Google does not name a number for it. The local run serves the diagnosis, not the reproduction of the score.
A single run is just as useless as a verdict. Because the simulation builds on an unthrottled trace, any load on the runner feeds straight into the model’s input data. During the V3 optimisation, identical code produced 52 points once and 95 points another time. Since then I always evaluate three runs and take the median. A good quick test for this is the TBT. If it sits above half a second while every other value looks unchanged, the runner was busy and the result says nothing about the page. The same applies locally. A Lighthouse run on a machine with a build running alongside is wasted time. Calm your own CPU first, then measure, then evaluate the JSON.
 Photo: kmuza / Unsplash
Step two, making the chain visible
If the observed value is small and the simulated one is large, the problem sits in the chain. The network-requests audit is still present in Lighthouse 13, in the “hidden” group with weight 0, and delivers networkRequestTime, networkEndTime, priority, transferSize and isLinkPreload per request, among other fields.
jq --argjson lcp "$(jq '.lighthouseResult.audits.metrics.details.items[0].observedLargestContentfulPaint' psi.json)" '
  .lighthouseResult.audits["network-requests"].details.items
  | map(select(.networkEndTime != null and .networkEndTime <= $lcp))
  | sort_by(-.networkEndTime)
  | .[0:10]
  | map({url, resourceType, priority, transferSize, networkRequestTime, networkEndTime})' psi.json
That is the list that matters. At the very top sits the candidate that sets the value inside the model. It is not necessarily the LCP image. In the V3 case it was speculative font loads, decorative full screen layers and a frame sequence. It is also worth pulling audits['largest-contentful-paint-element'] for the element including its phase breakdown, plus the filmstrip from audits['screenshot-thumbnails'], which you should actually look at rather than only export.
From the finding to the fix
Three patterns cover most cases.
Observed and simulated are both high. Then it is a genuine rendering problem and the usual levers apply, so TTFB, render blocking resources, image size. In the V3 case, 42 KB of external CSS alone was worth around 3.5 seconds of simulated LCP. Only after inlining did the other problems become measurable at all. Anyone working with Astro should know one trap here. build: { inlineStylesheets: 'always' } combined with dynamic import('@fontsource/...') means the CSS chunks are not written as files, while the Vite preload helper requests them anyway. The result is a rain of 404s. The way out was the FontFace API with static woff2 files in public/.
Observed low, simulated high, and the chain consists of network nodes. Then the task is not to load less but to start later. The only reliable approach for that was a gate on the largest-contentful-paint entry via PerformanceObserver. loading="lazy" does not take effect when the element sits inside the viewport, even at opacity: 0. requestIdleCallback fires practically immediately on fast machines. So does window.load, with identical code producing 2.1 seconds once and 6.2 seconds another time. I have described what such a gate looks like in detail in Deferring loading until after the LCP.
Observed low, simulated high, and the render delay share dominates. Then CPU nodes are sitting in the chain, weighted with factor 4. In the V3 case, a defer queue for synchronous inline scripts in the body helped, flushed after DOMContentLoaded via rAF and setTimeout(0). The observed paint fell from 1.34 to 1.07 seconds, and the CPU nodes were out of the Lantern chain. Loading only the web fonts that are actually used eagerly was equally effective, in this case going from 13 to 3. And one detail that runs against intuition. A full screen <img> as the LCP element made the simulation noticeably worse, because the image load moved into the chain with it. Text LCP beat image LCP.
What you should not do is remove preloads just because the number drops as a result. Issue 16539 describes exactly this effect and is open. There is no commitment from Google to change it.
 Photo: wwarby / Unsplash
What Lighthouse 13 changes about the diagnosis
Lighthouse 13.0 was released on 10 October 2025 and requires Node 22.19 or newer. According to the release notes, PageSpeed Insights has been running on it since 20 October 2025. According to the Chrome blog, eight audits have disappeared from the report and the JSON without replacement, among them offscreen-images, font-size and first-meaningful-paint. Anyone who wrote scripts against those keys now gets null.
None of that changes the scoring. The Chrome blog makes clear that nothing about the performance scoring has changed, because it rests on the metrics and not on the audits. The weights are unchanged, so TBT 30, LCP 25, CLS 25, FCP 10, Speed Index 10 and INP 0.
Insights have taken the place of the old audits, all with weight 0. The ones that matter for LCP diagnosis are above all lcp-breakdown-insight, lcp-discovery-insight, network-dependency-tree-insight and render-blocking-insight. The route there ran through Lighthouse 12.6 with Chrome 137, became the default from 12.7 in June 2025 and rolled out in PSI and DevTools with Chrome 139.
When the lab value does not matter
Google evaluates on field data from CrUX, not on the lab value from the simulation. The Search Console report on Core Web Vitals relies exclusively on that and shows the value reached by 75 per cent of page views over the last 28 days. PSI writes the difference into its own documentation, namely that lab data is good for debugging but does not necessarily reflect real bottlenecks.
In practice that means two things. The simulated value is a diagnostic tool and a sales argument, not a ranking factor. And if the field data is green while PSI shows 6 seconds, the page is fine and the model is telling you something about requests, not about users. The reverse holds just as much. A green lab value with red field data is a hint that the real devices and networks of your visitors look different from mobileSlow4G.
If you have a PageSpeed report in front of you where the number and the filmstrip do not match, feel free to send me the URL. I will look at observed against simulated and at the request chain, and tell you whether your problem sits in the rendering or in the graph.
FAQ
Why does PageSpeed Insights show a different LCP than Chrome DevTools?+
Because the two do different things. The DevTools performance recording shows the paint that was actually observed on your machine. PageSpeed Insights runs in its default mode with throttlingMethod simulate and then extrapolates the unthrottled load onto a slow mobile profile. In the Lighthouse default profile that means 1638 Kbps, 150 ms RTT and a CPU factor of 4. For PageSpeed Insights, Google adjusted the CPU factor according to its release note of 5 December 2024, without naming a number. One value is an observation, the other is a model calculation.
Where do I find the real LCP value in the Lighthouse report?+
In the JSON under audits.metrics.details.items[0].observedLargestContentfulPaint. The same object holds the simulated value as largestContentfulPaint, along with timeToFirstByte, lcpLoadDelay, lcpLoadDuration and lcpRenderDelay. None of that is visible in the HTML view, so you need the JSON export or the PageSpeed Insights API.
Is it worth removing preloads so the PageSpeed value improves?+
Often yes for the number, usually no for your users. In the open Lighthouse issue 16539 the reporter describes exactly this case. After modulepreload hints were removed the simulated value improved, while hydration rose from around 500 to around 2000 milliseconds. Optimising that way trades real load time for points.
Why do my PageSpeed results fluctuate so much?+
Because the runners share CPU and the unthrottled trace is the basis of the simulation. During the V3 optimisation of emit-solution.com, identical code was measured once at 52 and once at 95 points. The only sensible approach is the median of three runs. A TBT above 0.5 seconds with otherwise identical values points to a busy runner, not to a problem on the page.
Want to know more?
In a free intro call we discuss how you can use these topics for your company. Not a sales pitch, but an honest assessment.
Book a free intro call